2D Design: Data Visualization and Report Design
Data Visualization and Report Design Guidelines
Client
Washington State Department of Labor & Industries
Scope of Work
- Research
- Interviews
- Systems Mapping
- Design
- Data Visualization
- Graphic Standards
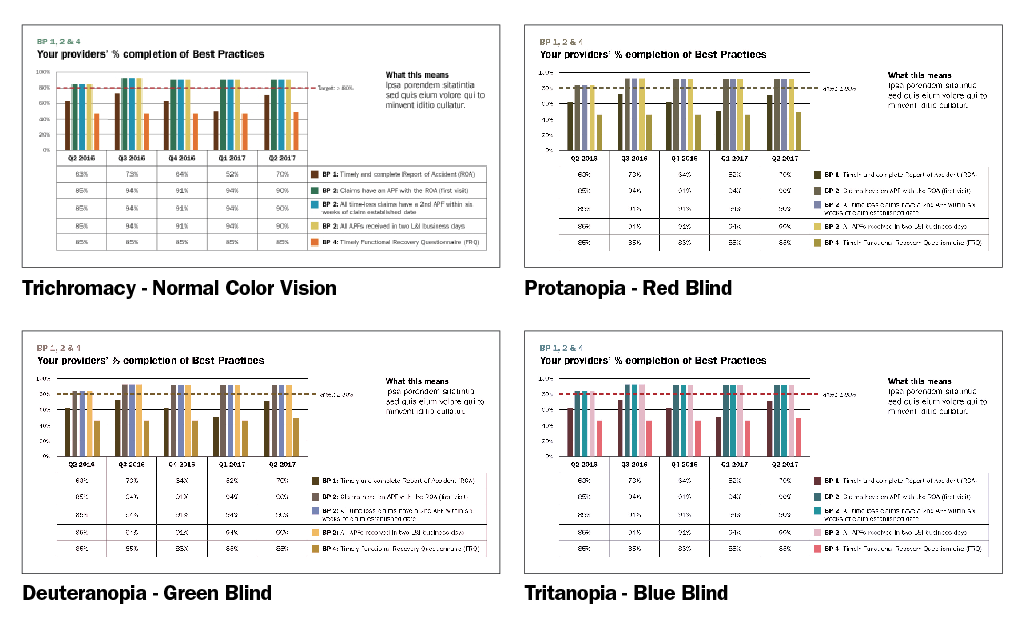
- ADA Considerations
- Model Reports
- Implementation Guidance
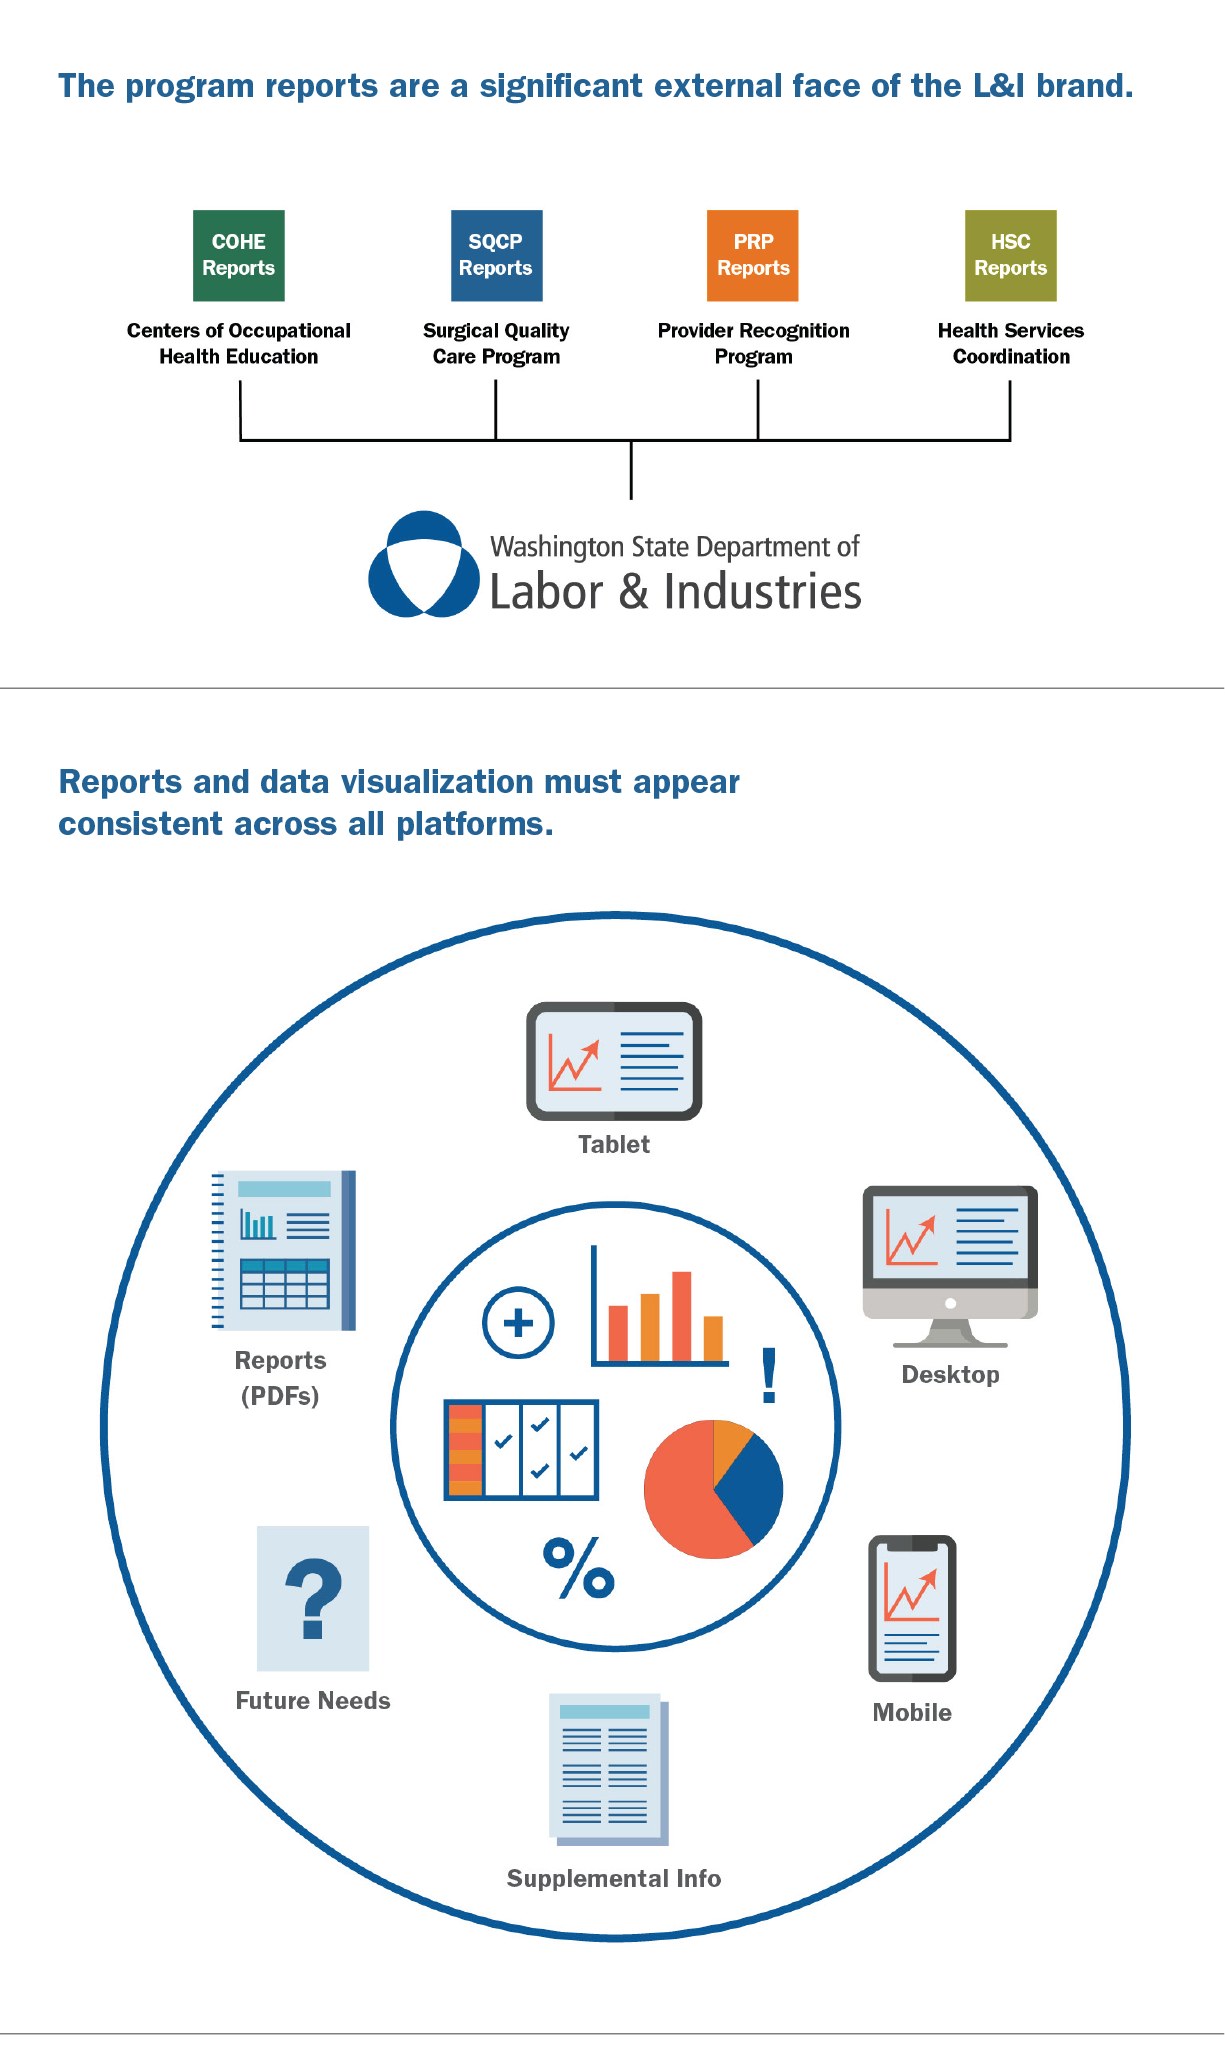
We are currently working with the Washington State Department of Labor and Industries to improve Occupational Healthcare reporting. The goal of this project is to promote the adoption of administrative best practices in order to minimize follow-up questions in case management, and to effectively use data visualization to improve reporting and outcomes. Our work required a systemic understanding of data and information flow between healthcare providers and state government to ensure optimal pathways to recovery for workers injured on the job. We incorporated a human-centered perspective of motivations and behavior as they pertain to measuring and reporting to a variety of healthcare audiences.
Through our research, we gained a more detailed and nuanced understanding of the communication pathways in Occupational Healthcare reporting in Washington and the need for improving decision-making and performance in an evolving context. Both internal and external stakeholders were interviewed to gain comprehensive knowledge of data requirements, information management capabilities, overall system comprehension and evolving technical capacity. We used these perspectives to develop improved tools for distribution of quantitative measures to influence preferred activities, to save tax dollars and, ultimately, to improve the long-term prospects for the workers in Washington.
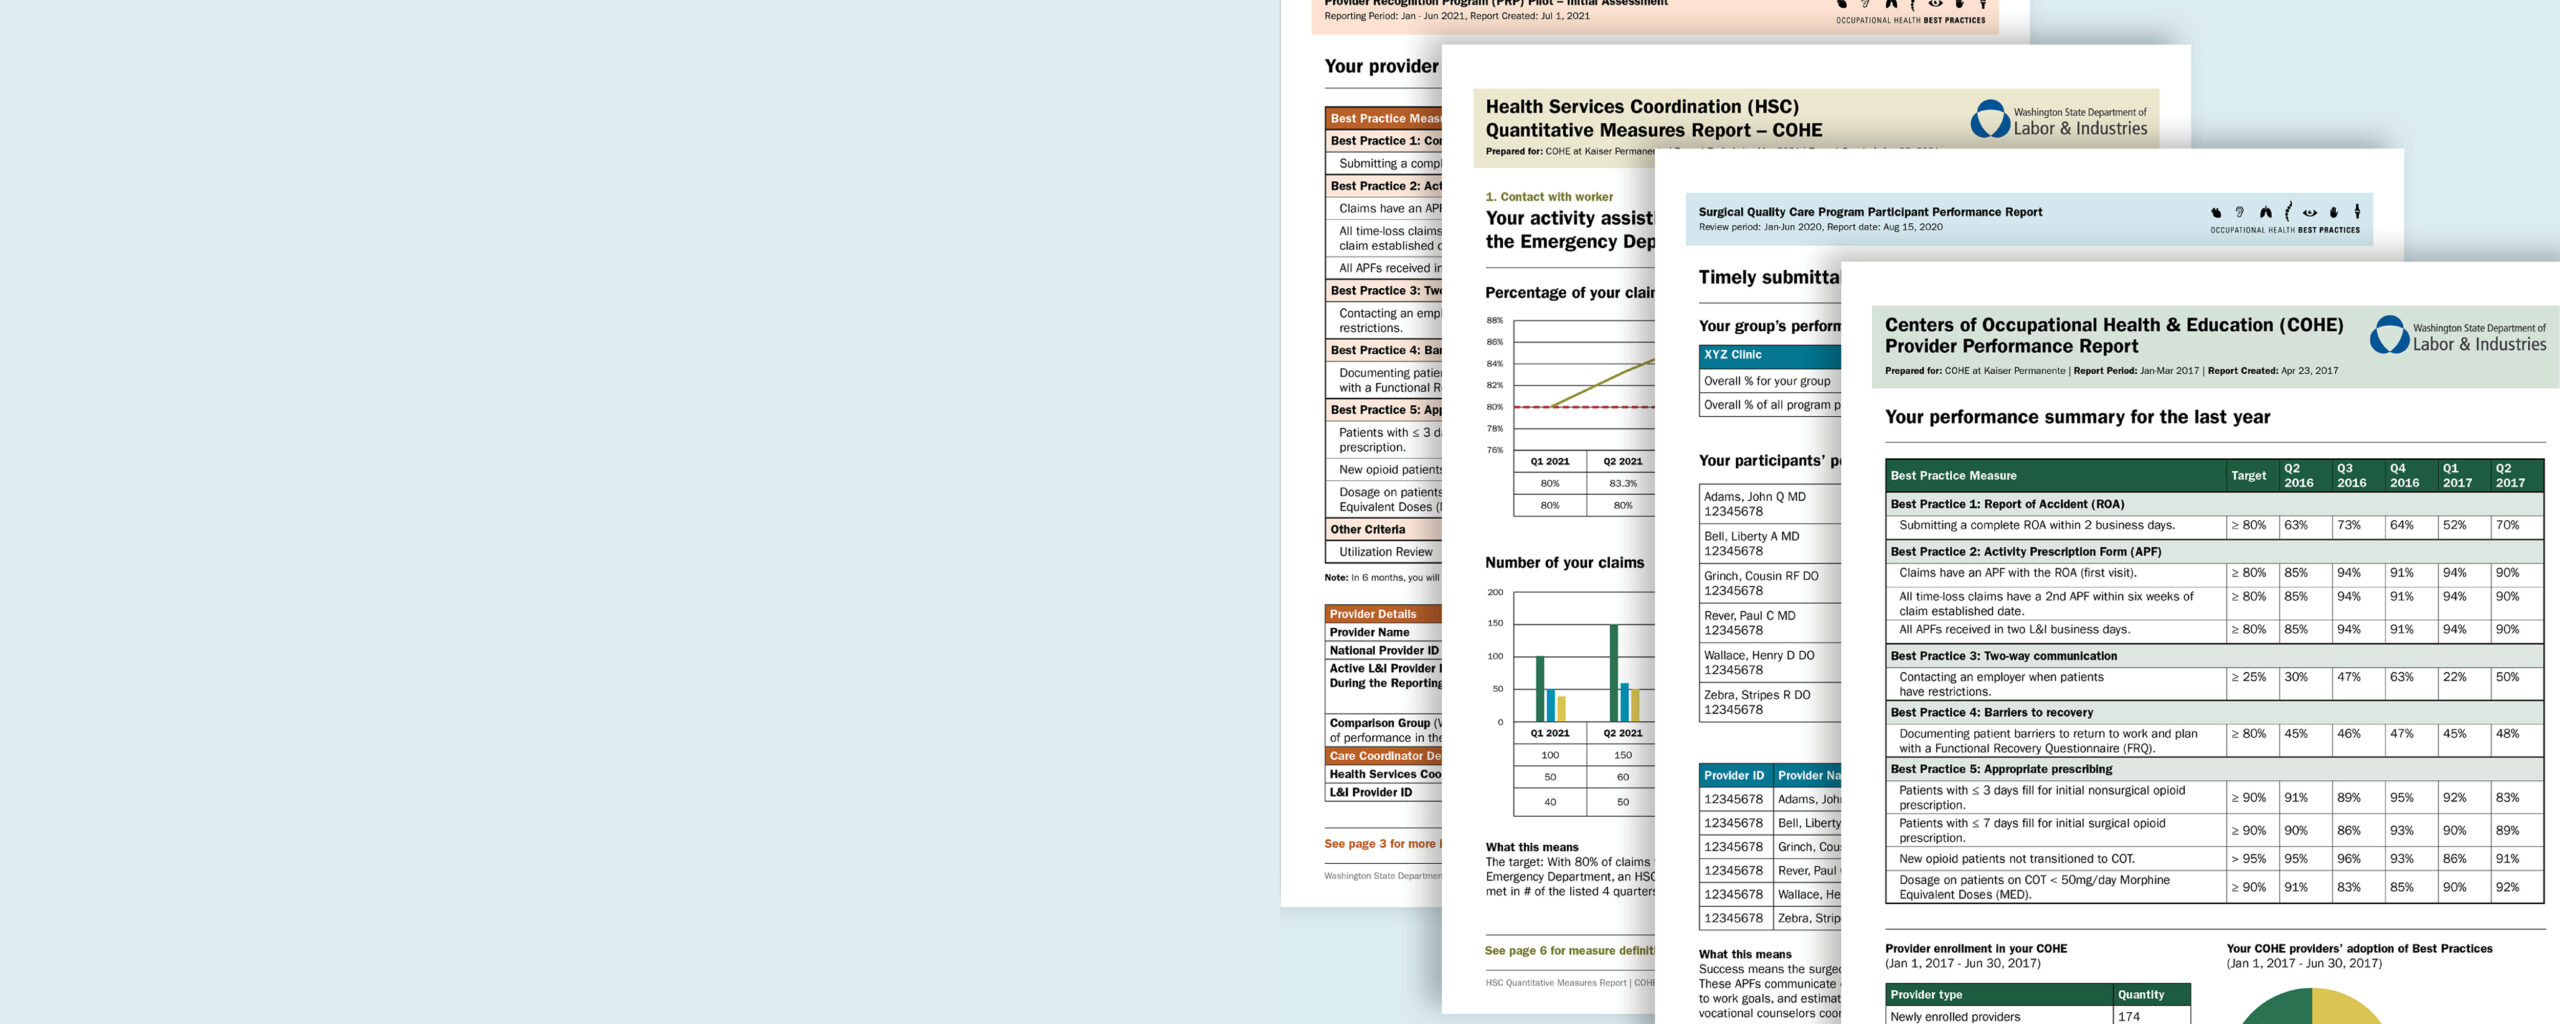
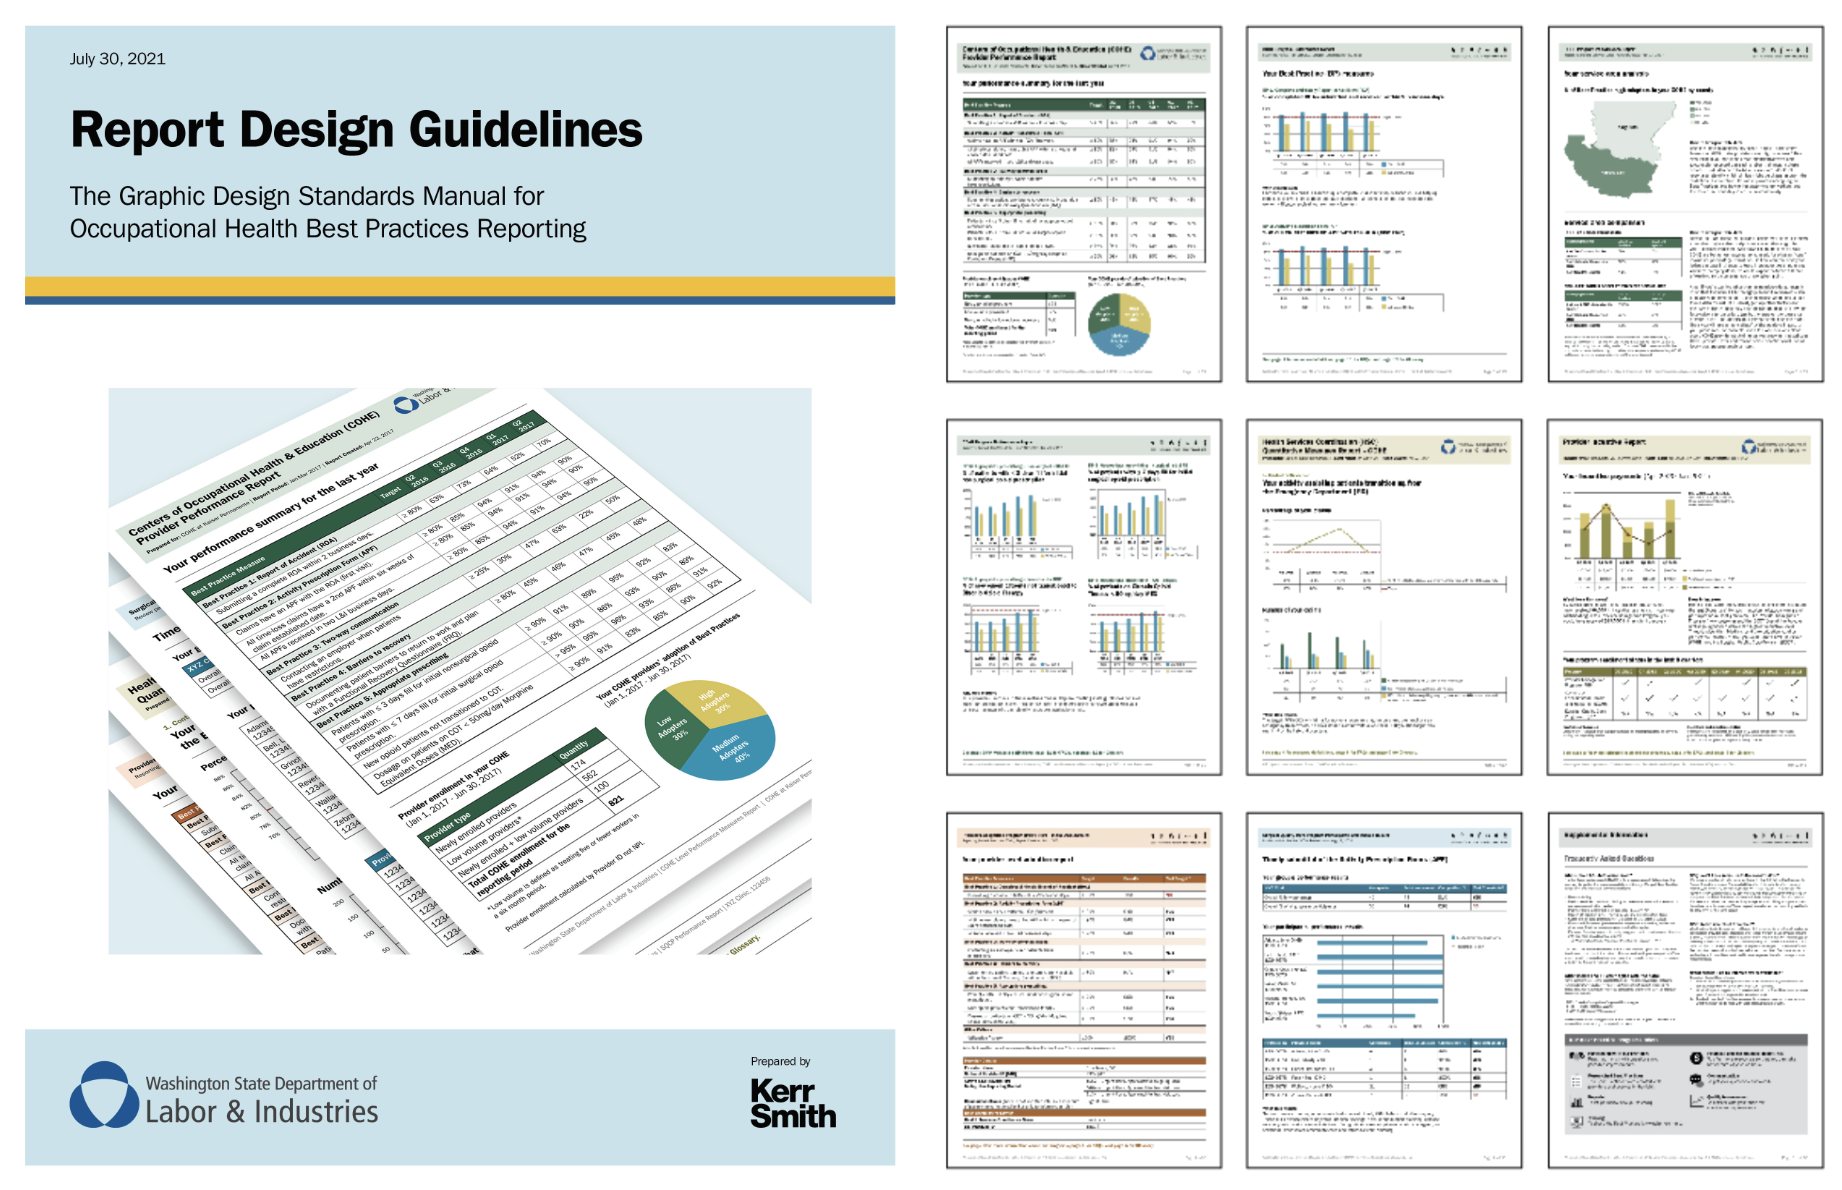
A summative report of our research, with proposed “Design Principles” and a range of best design practice techniques were presented. In the second stage of work, we integrated our recommendations into reporting samples design system with rigorous structure, typography and graphic styles. A set of nine different model reports were fully designed and written. We also developed a Supplemental Information section with FAQs, measurement information, detailed explanations of Best Practices and a Glossary of Terms. A 40 page Design Guidelines document was written and designed for ongoing production requirements for the systems of reports.
Nine different reports were written and designed for the four administrative programs. Info-graphics included bar charts, tables, maps, and pictograms. We established detailed design rules for all elements including typography and colour. We integrated clear didactic titles and explanations to accompany all the graphics.
© KerrSmith Design 2023